In this project, we aimed to forecast the unit sales volume for Walmart retail goods.
The dataset is from the Kaggle M5 competition and can be found here.
It used hierarchical sales data from Walmart, starting at the item level and aggregating to that of departments, product categories and stores in three geographical areas of the US: California, Texas, and Wisconsin.
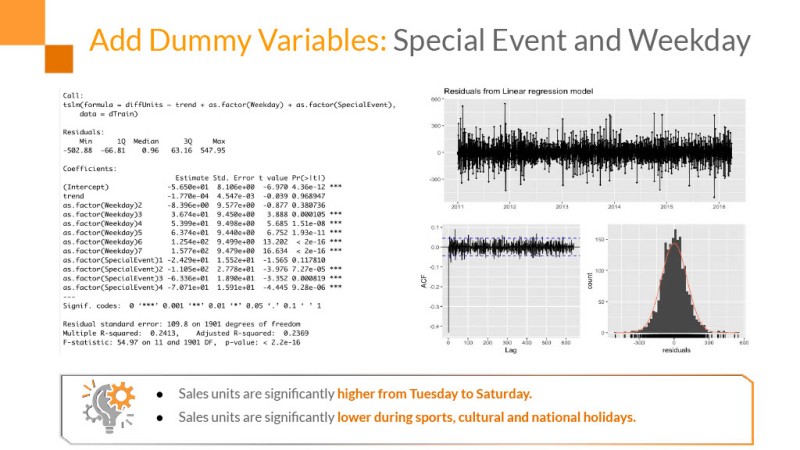
Besides the time series data, it also included explanatory variables such as price, promotions, day of the week, and special events (e.g. Super Bowl, Valentine’s Day, and Orthodox Easter) that affect sales which are used to improve forecasting accuracy.
The models used in this project to analyze time-series data and forecasting:
- Naive with Random Walk
- Regression with fouriers
- Simple Exponential Smoothing (SES)
- Holt Linear Trend (Drift)
- Holt Damped
- Holt Winter
- ETS
- ARMA
- ARIMA
We also conducted Marketing Mix Model to test how current and previous item price (lagged) affect the unit sales amount.
Here is our work: